The summers in the Northern Hemisphere are generally hotter than in the Southern Hemisphere for several reasons, including:
Tilt of the Earth: The Earth is tilted on its axis, which means that during the Northern Hemisphere summer, the North Pole is tilted towards the Sun, while during the Southern Hemisphere summer. This means that the Northern Hemisphere receives more direct sunlight and experiences longer days, which results in warmer temperatures.
Landmass: The Northern Hemisphere has more landmass than the Southern Hemisphere, which means that it heats up more quickly and retains heat for longer periods of time. This results in higher temperatures during the summer months.
Ocean Currents: The ocean currents in the Northern Hemisphere are warmer than those in the Southern Hemisphere, which also contributes to the warmer temperatures during the summer months.
Overall, the combination of these factors results in the Northern Hemisphere experiencing hotter summers than the Southern Hemisphere.
Notice the difference from the hottest temperature at the top of the list – to the coldest temperature at the bottom! The temperature spread on our planet is amazing! These are thehottest and coldest locations in the past 7 days that recorded the associated temperature for at least one hour.
Hottest Temps Last Week:
47C | 116F at Khartoum, KH, Sudan
44C | 111F at Delhi, DL, India
44C | 111F at Nagpur, MH, India
43C | 110F at Death Valley, CA, United States
43C | 109F at N’Djamena, ND, Chad
43C | 109F at Niamey, 8, Niger
42C | 108F at Dakar, DK, Senegal
42C | 108F at Abu Dhabi, AZ, United Arab Emirates
42C | 108F at Dubai, DU, United Arab Emirates
41C | 107F at Ahmedabad, GJ, India
42C | 107F at Muscat, MA, Oman
40C | 104F at Hyderabad, TG, India
39C | 102F at Da Nang, DN, Vietnam
38C | 100F at Bangkok, 10, Thailand
36C | 97F at Phoenix, AZ, United States
COLDEST Temps Last Week:
-61C | -77F at Concordia Station, 00, Antarctica
-57C | -71F at Amundsen-Scott South, 00, Antarctica
Temperatures around the Earth can vary greatly depending on a number of factors such as geography, climate, time of day, and season.
At any given moment, temperatures can vary by hundreds of degrees Celsius between the hottest and coldest places on Earth. The coldest place on Earth is Antarctica, where temperatures can drop as low as -90°C (-130°F) in the winter. In contrast, the hottest place on Earth is the Lut Desert in Iran, where temperatures have reached up to 71°C (160°F) in the summer.
Additionally, temperature differences can also be observed between regions with different climate zones. For example, the temperature difference between the equator and the poles can be quite significant, with temperatures in tropical regions typically staying warm year-round while polar regions experience extreme cold during the winter months.
Overall, the temperature differences around the Earth can be quite large and vary depending on a wide range of factors.
Earth’s weather and temperature is constantly changing. Our website stores the warmest and coolest global temperatures every hour. Those locations that make it into the 30 hottest and coldest in the last seven days are displayed on this page. The temperatures are sorted from hottest to coldest.
Hottest Temps Last Week:
47C | 116F at Khartoum, KH, Sudan
46C | 115F at Basra, BA, Iraq
46C | 114F at Khartoum, KH, Sudan
45C | 113F at Nagpur, MH, India
45C | 113F at Basra, BA, Iraq
45C | 113F at Khartoum, KH, Sudan
45C | 112F at Nagpur, MH, India
45C | 112F at Khartoum, KH, Sudan
44C | 111F at N’Djamena, ND, Chad
44C | 111F at Ahmedabad, GJ, India
44C | 111F at Nagpur, MH, India
44C | 111F at Basra, BA, Iraq
44C | 111F at Niamey, 8, Niger
44C | 111F at Khartoum, KH, Sudan
43C | 110F at Ahmedabad, GJ, India
44C | 110F at Nagpur, MH, India
44C | 110F at Khartoum, KH, Sudan
43C | 109F at N’Djamena, ND, Chad
43C | 109F at Ahmedabad, GJ, India
43C | 109F at Nagpur, MH, India
43C | 109F at Mandalay, 04, Myanmar
43C | 109F at Niamey, 8, Niger
43C | 109F at Khartoum, KH, Sudan
42C | 108F at N’Djamena, ND, Chad
42C | 108F at Ahmedabad, GJ, India
43C | 108F at Nagpur, MH, India
42C | 108F at Mandalay, 04, Myanmar
42C | 108F at Niamey, 8, Niger
42C | 108F at Khartoum, KH, Sudan
42C | 108F at Abu Dhabi, AZ, United Arab Emirates
42C | 107F at Basra, BA, Iraq
42C | 107F at Mandalay, 04, Myanmar
41C | 106F at Ahmedabad, GJ, India
41C | 106F at Nagpur, MH, India
41C | 106F at Niamey, 8, Niger
41C | 106F at Khartoum, KH, Sudan
41C | 105F at Ahmedabad, GJ, India
41C | 105F at Mandalay, 04, Myanmar
41C | 105F at Death Valley, CA, United States
40C | 104F at N’Djamena, ND, Chad
40C | 104F at Niamey, 8, Niger
40C | 104F at Khartoum, KH, Sudan
40C | 104F at Death Valley, CA, United States
39C | 103F at Ahmedabad, GJ, India
39C | 103F at Nagpur, MH, India
39C | 103F at Mandalay, 04, Myanmar
39C | 103F at Muscat, MA, Oman
40C | 103F at Khartoum, KH, Sudan
39C | 103F at Death Valley, CA, United States
39C | 102F at Nay Pyi Taw, 18, Myanmar
39C | 102F at Mandalay, 04, Myanmar
39C | 102F at Niamey, 8, Niger
39C | 102F at Muscat, MA, Oman
39C | 102F at Death Valley, CA, United States
39C | 101F at Mérida, YUC, Mexico
39C | 101F at Khartoum, KH, Sudan
38C | 101F at Death Valley, CA, United States
38C | 100F at Ahmedabad, GJ, India
38C | 100F at Nagpur, MH, India
38C | 100F at Mérida, YUC, Mexico
38C | 100F at Niamey, 8, Niger
38C | 100F at Death Valley, CA, United States
37C | 99F at Delhi, DL, India
37C | 99F at Mexicali, BCN, Mexico
37C | 99F at Nay Pyi Taw, 18, Myanmar
37C | 99F at Mandalay, 04, Myanmar
37C | 99F at Mérida, YUC, Mexico
37C | 99F at Managua, MN, Nicaragua
37C | 99F at Niamey, 8, Niger
37C | 99F at Del Rio, TX, United States
37C | 99F at Terlingua, TX, United States
37C | 98F at Death Valley, CA, United States
36C | 97F at Niamey, 8, Niger
36C | 97F at Midland, TX, United States
35C | 96F at Delhi, DL, India
36C | 96F at Ahmedabad, GJ, India
35C | 96F at Nagpur, MH, India
36C | 96F at Terlingua, TX, United States
36C | 96F at Death Valley, CA, United States
35C | 95F at Niamey, 8, Niger
35C | 95F at Midland, TX, United States
35C | 95F at Death Valley, CA, United States
35C | 94F at Nagpur, MH, India
35C | 94F at Mandalay, 04, Myanmar
34C | 94F at Roswell, NM, United States
34C | 93F at Jakarta, JK, Indonesia
34C | 93F at Nay Pyi Taw, 18, Myanmar
34C | 93F at Niamey, 8, Niger
34C | 93F at Bangkok, 10, Thailand
33C | 92F at Wari, C, Bangladesh
33C | 92F at Muscat, MA, Oman
33C | 91F at Phoenix, AZ, United States
9C | 48F at Ruidoso, NM, United States
COLDEST Temps Last Week:
9C | 48F at Ruidoso, NM, United States
-16C | 3F at Alert, NU, Canada
-45C | -49F at Concordia Station, 00, Antarctica
-46C | -51F at Amundsen-Scott South, 00, Antarctica
-46C | -51F at Concordia Station, 00, Antarctica
-47C | -52F at Amundsen-Scott South, 00, Antarctica
-48C | -54F at Concordia Station, 00, Antarctica
-50C | -57F at Amundsen-Scott South, 00, Antarctica
-50C | -57F at Concordia Station, 00, Antarctica
-51C | -59F at Amundsen-Scott South, 00, Antarctica
-51C | -59F at Concordia Station, 00, Antarctica
-52C | -62F at Amundsen-Scott South, 00, Antarctica
-53C | -63F at Concordia Station, 00, Antarctica
-53C | -64F at Amundsen-Scott South, 00, Antarctica
-53C | -64F at Concordia Station, 00, Antarctica
-54C | -65F at Amundsen-Scott South, 00, Antarctica
-54C | -65F at Concordia Station, 00, Antarctica
-56C | -68F at Amundsen-Scott South, 00, Antarctica
-55C | -68F at Concordia Station, 00, Antarctica
-56C | -69F at Amundsen-Scott South, 00, Antarctica
-57C | -70F at Concordia Station, 00, Antarctica
-57C | -71F at Amundsen-Scott South, 00, Antarctica
-57C | -71F at Concordia Station, 00, Antarctica
-58C | -72F at Amundsen-Scott South, 00, Antarctica
-58C | -72F at Concordia Station, 00, Antarctica
-58C | -73F at Amundsen-Scott South, 00, Antarctica
-58C | -73F at Concordia Station, 00, Antarctica
-59C | -74F at Amundsen-Scott South, 00, Antarctica
-59C | -74F at Concordia Station, 00, Antarctica
-59C | -75F at Amundsen-Scott South, 00, Antarctica
-60C | -75F at Concordia Station, 00, Antarctica
-60C | -76F at Amundsen-Scott South, 00, Antarctica
-60C | -76F at Concordia Station, 00, Antarctica
-61C | -77F at Amundsen-Scott South, 00, Antarctica
-60C | -77F at Concordia Station, 00, Antarctica
-61C | -78F at Amundsen-Scott South, 00, Antarctica
-61C | -78F at Concordia Station, 00, Antarctica
-66C | -87F at Amundsen-Scott South, 00, Antarctica
The temperature range between the Earth’s poles is drastic due to a combination of factors, including the tilt of the Earth’s axis, the distribution of sunlight, and the circulation of ocean currents and air masses.
One of the main reasons for the temperature difference is that the Earth’s axis is tilted at an angle of approximately 23.5 degrees relative to the plane of its orbit around the Sun. This means that the poles receive sunlight at a very oblique angle, resulting in less intense solar radiation and cooler temperatures.
Additionally, the distribution of sunlight is uneven due to the Earth’s rotation and the presence of the atmosphere, which causes some areas to receive more or less sunlight than others. The poles receive very little direct sunlight during the winter months, which leads to prolonged periods of darkness and extreme cold.
Finally, the circulation of ocean currents and air masses plays a significant role in the temperature differences between the poles. The ocean currents near the poles are cold and dense, which causes them to sink and flow towards the equator, while warm currents from the equator flow towards the poles. Similarly, cold air masses from the poles move towards the equator, while warm air masses from the equator move towards the poles.
All of these factors combine to create a drastic temperature range between the Earth’s poles, with the Arctic and Antarctic experiencing some of the coldest temperatures on the planet.
The weather surrounding our planet is in constant change. We are recording the extreme world temperatures hourly. This page presents the locations ( for which we receive data ) that made it into the top 30 hottest and bottom 30 coldest locations. The temperatures displayed are for one or more hours per the indicated location during the last 7 days. Hottest at the top of the list, Coldest at the bottom.
Hottest Temps Last Week:
44C | 111F at N’Djamena, ND, Chad
43C | 110F at Basra, BA, Iraq
43C | 109F at N’Djamena, ND, Chad
43C | 109F at Niamey, 8, Niger
43C | 109F at Khartoum, KH, Sudan
42C | 108F at N’Djamena, ND, Chad
42C | 108F at Mandalay, 04, Myanmar
42C | 108F at Niamey, 8, Niger
42C | 108F at Khartoum, KH, Sudan
42C | 108F at Vientiane, VT, Laos
42C | 107F at Nay Pyi Taw, 18, Myanmar
41C | 106F at N’Djamena, ND, Chad
41C | 106F at Nay Pyi Taw, 18, Myanmar
41C | 106F at Mandalay, 04, Myanmar
41C | 106F at Niamey, 8, Niger
41C | 106F at Riyadh, 01, Saudi Arabia
41C | 106F at Khartoum, KH, Sudan
41C | 106F at Vientiane, VT, Laos
40C | 105F at Nay Pyi Taw, 18, Myanmar
40C | 104F at N’Djamena, ND, Chad
40C | 104F at Nay Pyi Taw, 18, Myanmar
40C | 104F at Mandalay, 04, Myanmar
40C | 104F at Niamey, 8, Niger
40C | 104F at Vientiane, VT, Laos
40C | 103F at Nay Pyi Taw, 18, Myanmar
39C | 103F at Mandalay, 04, Myanmar
39C | 103F at Vientiane, VT, Laos
39C | 102F at Nay Pyi Taw, 18, Myanmar
39C | 102F at Mandalay, 04, Myanmar
39C | 102F at Mérida, YUC, Mexico
39C | 102F at Niamey, 8, Niger
39C | 102F at Vientiane, VT, Laos
38C | 101F at Nay Pyi Taw, 18, Myanmar
38C | 101F at Mérida, YUC, Mexico
38C | 101F at Tapachula de Córdova, CHP, Mexico
38C | 100F at N’Djamena, ND, Chad
38C | 100F at Nay Pyi Taw, 18, Myanmar
38C | 100F at Mérida, YUC, Mexico
38C | 100F at Niamey, 8, Niger
38C | 100F at Del Rio, TX, United States
38C | 100F at Vientiane, VT, Laos
38C | 99F at Nay Pyi Taw, 18, Myanmar
37C | 99F at Yangon, 06, Myanmar
37C | 99F at Vientiane, VT, Laos
37C | 98F at Nay Pyi Taw, 18, Myanmar
37C | 98F at Mérida, YUC, Mexico
36C | 97F at Mandalay, 04, Myanmar
36C | 97F at Niamey, 8, Niger
36C | 97F at Del Rio, TX, United States
36C | 97F at Da Nang, DN, Vietnam
36C | 97F at Ho Chi Minh City, SG, Vietnam
36C | 97F at Vientiane, VT, Laos
35C | 96F at Nay Pyi Taw, 18, Myanmar
35C | 95F at Managua, MN, Nicaragua
35C | 95F at Da Nang, DN, Vietnam
35C | 95F at Ho Chi Minh City, SG, Vietnam
35C | 94F at Mérida, YUC, Mexico
34C | 94F at Roswell, NM, United States
34C | 93F at Nay Pyi Taw, 18, Myanmar
34C | 93F at Mandalay, 04, Myanmar
34C | 93F at Managua, MN, Nicaragua
34C | 93F at Niamey, 8, Niger
34C | 93F at Del Rio, TX, United States
34C | 93F at Phoenix, AZ, United States
34C | 93F at Ho Chi Minh City, SG, Vietnam
34C | 93F at Forbes Park, MNL, Philippines
33C | 91F at Port Moresby, NCD, Papua New Guinea
0C | 32F at Lordstown, OH, United States
COLDEST Temps Last Week:
0C | 32F at Lordstown, OH, United States
-45C | -49F at Concordia Station, 00, Antarctica
-48C | -54F at Amundsen-Scott South, 00, Antarctica
-48C | -54F at Concordia Station, 00, Antarctica
-48C | -55F at Amundsen-Scott South, 00, Antarctica
-48C | -55F at Concordia Station, 00, Antarctica
-49C | -56F at Amundsen-Scott South, 00, Antarctica
-49C | -56F at Concordia Station, 00, Antarctica
-50C | -57F at Amundsen-Scott South, 00, Antarctica
-50C | -57F at Concordia Station, 00, Antarctica
-50C | -58F at Amundsen-Scott South, 00, Antarctica
-51C | -60F at Concordia Station, 00, Antarctica
-53C | -64F at Amundsen-Scott South, 00, Antarctica
-53C | -64F at Concordia Station, 00, Antarctica
-55C | -66F at Amundsen-Scott South, 00, Antarctica
-55C | -66F at Concordia Station, 00, Antarctica
-55C | -67F at Amundsen-Scott South, 00, Antarctica
-55C | -67F at Concordia Station, 00, Antarctica
-55C | -68F at Amundsen-Scott South, 00, Antarctica
-56C | -68F at Concordia Station, 00, Antarctica
-56C | -69F at Amundsen-Scott South, 00, Antarctica
-56C | -69F at Concordia Station, 00, Antarctica
-56C | -70F at Amundsen-Scott South, 00, Antarctica
-58C | -73F at Concordia Station, 00, Antarctica
-59C | -74F at Amundsen-Scott South, 00, Antarctica
-59C | -74F at Concordia Station, 00, Antarctica
-59C | -75F at Amundsen-Scott South, 00, Antarctica
-60C | -76F at Concordia Station, 00, Antarctica
-61C | -77F at Amundsen-Scott South, 00, Antarctica
-61C | -77F at Concordia Station, 00, Antarctica
-62C | -79F at Amundsen-Scott South, 00, Antarctica
-62C | -79F at Concordia Station, 00, Antarctica
-69C | -92F at Amundsen-Scott South, 00, Antarctica
Data based on our extreme 30 hottest and 30 coldest reporting stations.
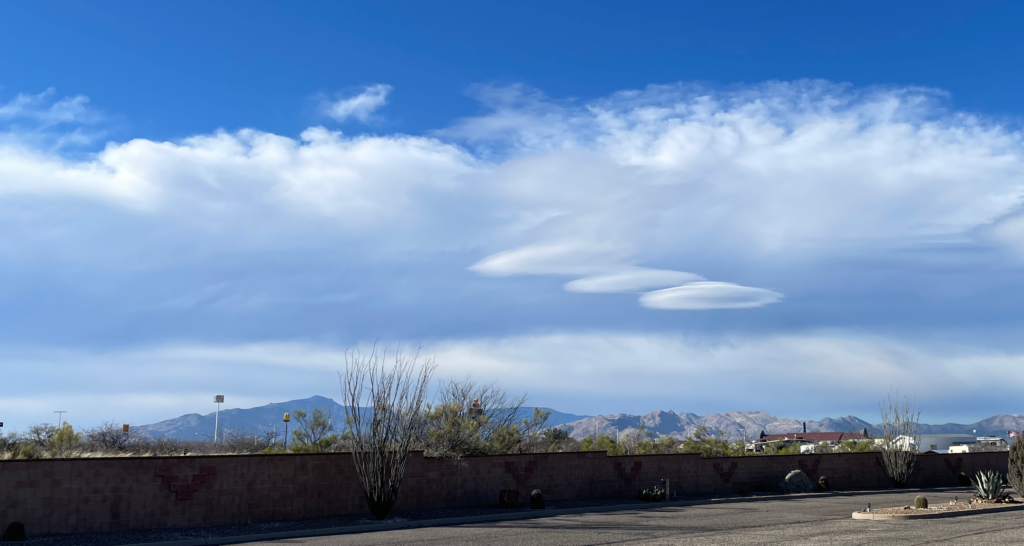
I was minding my own business, just walking around in the desert. When I returned to our front gate my eyes were lured up to these wonderful Alien Spaceships. I grabbed the phone out of my pocket and snapped these two photos before they teleported over to Roswell!
UFO’s flying in formation
Lenticular Clouds
Lenticular clouds are shaped like lenses or almonds or…flying saucers! They may get their shape from hilly terrain or just the way the air is rising over flat terrain.
The rain gauge is the first known weather recording instrument developed. In ancient time bowls were used to collect and measure rainfall amounts.The amount of rain measured helped decide how much crop to plant and delegate the appropriate amount of seed.
China had flooding problems and they were determined to deal with it. In or about the year 1247 the Chinese placed rain gauges at district capitols and snow gauges made of bamboo were placed in mountain passes. With the measured rainfall and snowfall programs could be put in action to prepare for potential flooding.
It is said the first standardized rain gauges were developed in Koera. In the year 1441 the new rain gauges were widely dispersed and monitored to help improve rice crops.6,7
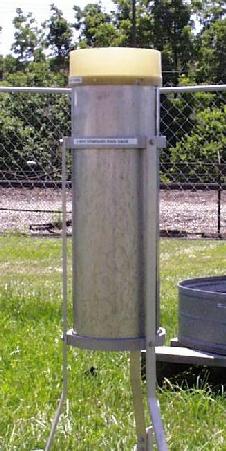
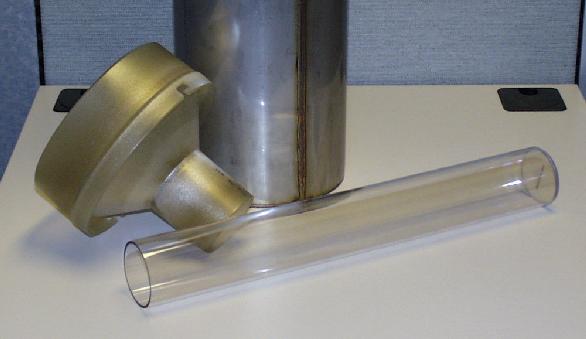
In our modern era meteorologists use rain gauges constructed with an 200mm (8-inch) funnel at top that fills a smaller diameter tube. 11 See the following images taken from National Weather Service.
8 Inch Standard Rain GageFunnel and Measuring Tube, 8 Inch standard rain gage
With the funnel providing a larger catch area the smaller tube fills more rapidly. One inch of rainfall fills the tube to 10 inches. This configuration allows for more accurate readings.The rainfall is measured by placing a measuring stick to the bottom, removing and reading where the water ‘wetness’ ends on the stick, similar to checking engine oil with a dip-stick.
Q: When was the thermometer developed?
Brief History of the Thermometer
The first known thermometer style apparatus was developed by Galileo Galilei in 1593 and was named a Thermoscope4. It was an open air device with an upside down hollow glass bulb in which is a glass straw extending down into a cup of liquid. As the bulb was cooled (the air was shrinking) it pulled liquid up the straw. You can see a replica thermoscope if you watch this Youtube video2 and note he first warms the bulb and then puts ice on top: 4E10.11 – Galileo’s Air Thermoscope. The thermoscope was affected by barometric pressure and temperature making it unreliable for either type of measurement. In about 1632 Jean Rey, a French physician, inverted Galileo’s device filling the bulb with liquid making it more reliable4. In 1657-1667 a group of Galileo’s students at Accademia del Cimento refined the design by sealing glass tube and the glass bulbs were filled with liquid. There upon graduations were put on the tube to note a temperature scale. It is referred to as the “Florentine Thermometer”.3 This formed the basic design of thermometers in use today.
Florentine Thermometer at Whipple Museum
The Fahrenheit Thermometer
Daniel Gabriel Fahrenheit, an instrument make and physicist, invented the alcohol thermometer in 1709. In 1714 Fahrenheit changed the thermometer’s liquid to mercury because it’s boiling point was thought to approximately 300 degrees. It is his change to the thermometer scale for which we all know the name Fahrenheit. After experimentation he set the freezing point of water at 32 degrees and boiling point of water exactly 180 degrees higher was set to 212 degrees. Zero degrees is the point at which an equal portion of salt and water freeze. It was thought at that time that temperature did not get colder than 0 and thermometers did not go lower than that.8
the Original Fahrenheit Thermometer
The Celsius Thermometer
Anders Celsius created his temperature scale in 1742. It was labeled the Centigrade Scale (divided by 100) which spanned from 100° C to 0°C. Using the mercury thermometer his scale was initially had 0°C as the boiling point of water. It was soon switched to put freezing point of water at 0°C and water’s boiling point at 100°C. In 1948 the scale was renamed Celsius to honor the inventor.9
The First Organized Weather Recordings
The Medici Network
The Medici Network: The World’s First Meteorological Network (1654-1670)5. This is also the period for the invention of the Florentine Thermometer. Prince Leopold de’ Medici (1617-1675) and his brother the Grand Duke of Tuscany Ferdinand II (1610-1670) determined to research, invent apparatus as required and record weather parameters. The network consisted of stations at: 1-Florence, 2-Vallombrosa, 3-Pisa, 4-Cutigliano, 5-Bologna, 6-Parma, 7-Milan, 8-Innsbruck, 9-Warsaw, 10-Osnabruck, and 11-Paris. Their program was short-lived because of distrust by the church: “Any new philosophy of nature, based on scientific research was distrusted by the Roman Catholic Church and considered too dangerous”. The group disbanded after the two brothers deaths5. The Florentine Thermometer was proven accurate back then and even recently when compared to present day thermometers.
Because of the fear caused by church and state there is no more weather recordings for 97 years!
The Longest Continuous Temperature Recordings in the World
Hadley Centre Central England Temperature (HadCET) dataset: beginning in 1659, is claimed as the longest continuous instrumental record of temperature in the world. Data is for a region in the United Kingdom enclosed by cities Lancashire, London and Bristol. In 1659 monthly averages were published. Beginning in 1772 they published daily averages, and continue to do so today! 10
Summary:
My research finds the first recorded uniform rain gauges were in 1247 in China. The first recorded systematic temperature recordings were in 1654.